Wildfire case study · New Mexico, United States · 2024
South Fork illustrates why a wildfire study needs a second timeline after the flames: soil assessment, rain, channel response and downstream exposure. This record compares dated agency figures, reproduces a severity comparison and examines a conditional debris-flow map without turning it into a prediction for every property.
What this study establishes. Published severity shares describe the mapped soil classes; they do not directly measure flood probability. An incident acreage and a BAER assessment acreage may also describe different products. This study preserves their dates and labels rather than choosing the largest number as the definitive answer.
South Fork Fire 2024: the event and the cause finding
The interagency update records a 17 June 2024 start and identifies South Fork with the Ruidoso area. It lists Salt separately, west of Mescalero. Treating the two as one undifferentiated fire loses the identity needed to compare their later soil assessments. [2]
The Bureau of Indian Affairs says South Fork was reported on Mescalero Apache Reservation trust land and attributes its origin to lightning after an interagency investigation. The statement includes a 3 July status checkpoint. That is an agency cause finding for South Fork; it does not establish a cause for the separate Salt Fire. [1]
The research question here concerns the transition from fire to watershed response. A cause finding, suppression progress and a post-fire hazard assessment answer different questions. None supplies, by itself, a building-level loss model or a household evacuation history. This record therefore does not infer casualties, structure totals or evacuation compliance from the soil map.
How many acres burned? Keep the product and date attached
| Report checkpoint | South Fork | Salt | Source and context |
|---|---|---|---|
| 2 July 2024 | 17,569 | 7,939 | Interagency incident update [2] |
| 3 July 2024 | 16,613 | 7,652 | BAER daily operational bulletin [3] |
| 17 July 2024 | 17,066 | 7,688 | BAER summary hosted by Ruidoso [4] |
Our arithmetic: 17,569 − 16,613 = 956 acres for South Fork. The difference is about 5.8% of the 3 July BAER figure. For Salt, 7,939 − 7,652 = 287 acres. These are differences between reported numbers, not measurements of where additional ground burned.
Chronology is enough to rule out a simple growth narrative: the earlier incident number is already larger than the later BAER number. A changing perimeter, a different assessment footprint or a reporting revision could explain discrepancies, but these short summaries do not demonstrate which explanation applies. Adding the difference to a map would invent geography.
A reproducible area reconciliation would need each boundary version, its coordinate reference system, the area calculation method and any exclusions. Until those are available, retain both figures with their source labels. Do not splice an acreage from one product into severity percentages from another and then present the resulting acres as a verified class inventory.
Similar combined severity shares, different high-severity shares
The 3 July bulletin gives separate unburned and low classes for South Fork but combines those classes for Salt. We combine the South Fork classes for the three-bin comparison below. This is a transparent grouping of published percentages, not a new classification of satellite pixels. [3]
| Category | South Fork | Salt | Treatment in this study |
|---|---|---|---|
| Low or unburned | 34.3% | 36.6% | South Fork: 11.0 + 23.3; Salt: reported combined class |
| Moderate | 46.2% | 59.2% | Reported shares |
| High | 19.5% | 4.2% | Reported shares |
| Moderate + high | 65.7% | 63.4% | Calculated sum; overlaps the two rows above |
The combined shares differ by only 2.3 percentage points, while the high-only shares differ by 15.3 percentage points. The same data therefore support two different comparisons depending on the stated question. Reporting only the combined figure would hide the difference in the upper class.
Neither comparison ranks every downstream location. A whole-fire percentage does not describe the spatial arrangement of burned hillslopes, their connection to a particular channel, the storm over that catchment or what lies at its outlet. Similar summary shares can coexist with different local exposure. The chart helps compare the reported distributions; a property assessment requires spatial evidence.
| Class label | 3 July bulletin [3] | 17 July summary [4] |
|---|---|---|
| Unburned / very low or unburned | 11.0% | 11% |
| Low | 23.3% | 23% |
| Moderate | 46.2% | 46% |
| High | 19.5% | 20% |
The later values are compatible with rounding the earlier figures to whole percentages, using conventional half-up rounding for 19.5. That numerical compatibility does not prove the maps, boundaries or denominators were identical. It also does not establish that a class expanded between the two dates. We retain the slight change in the lowest class label.
The debris-flow map uses a 15-minute rainfall scenario
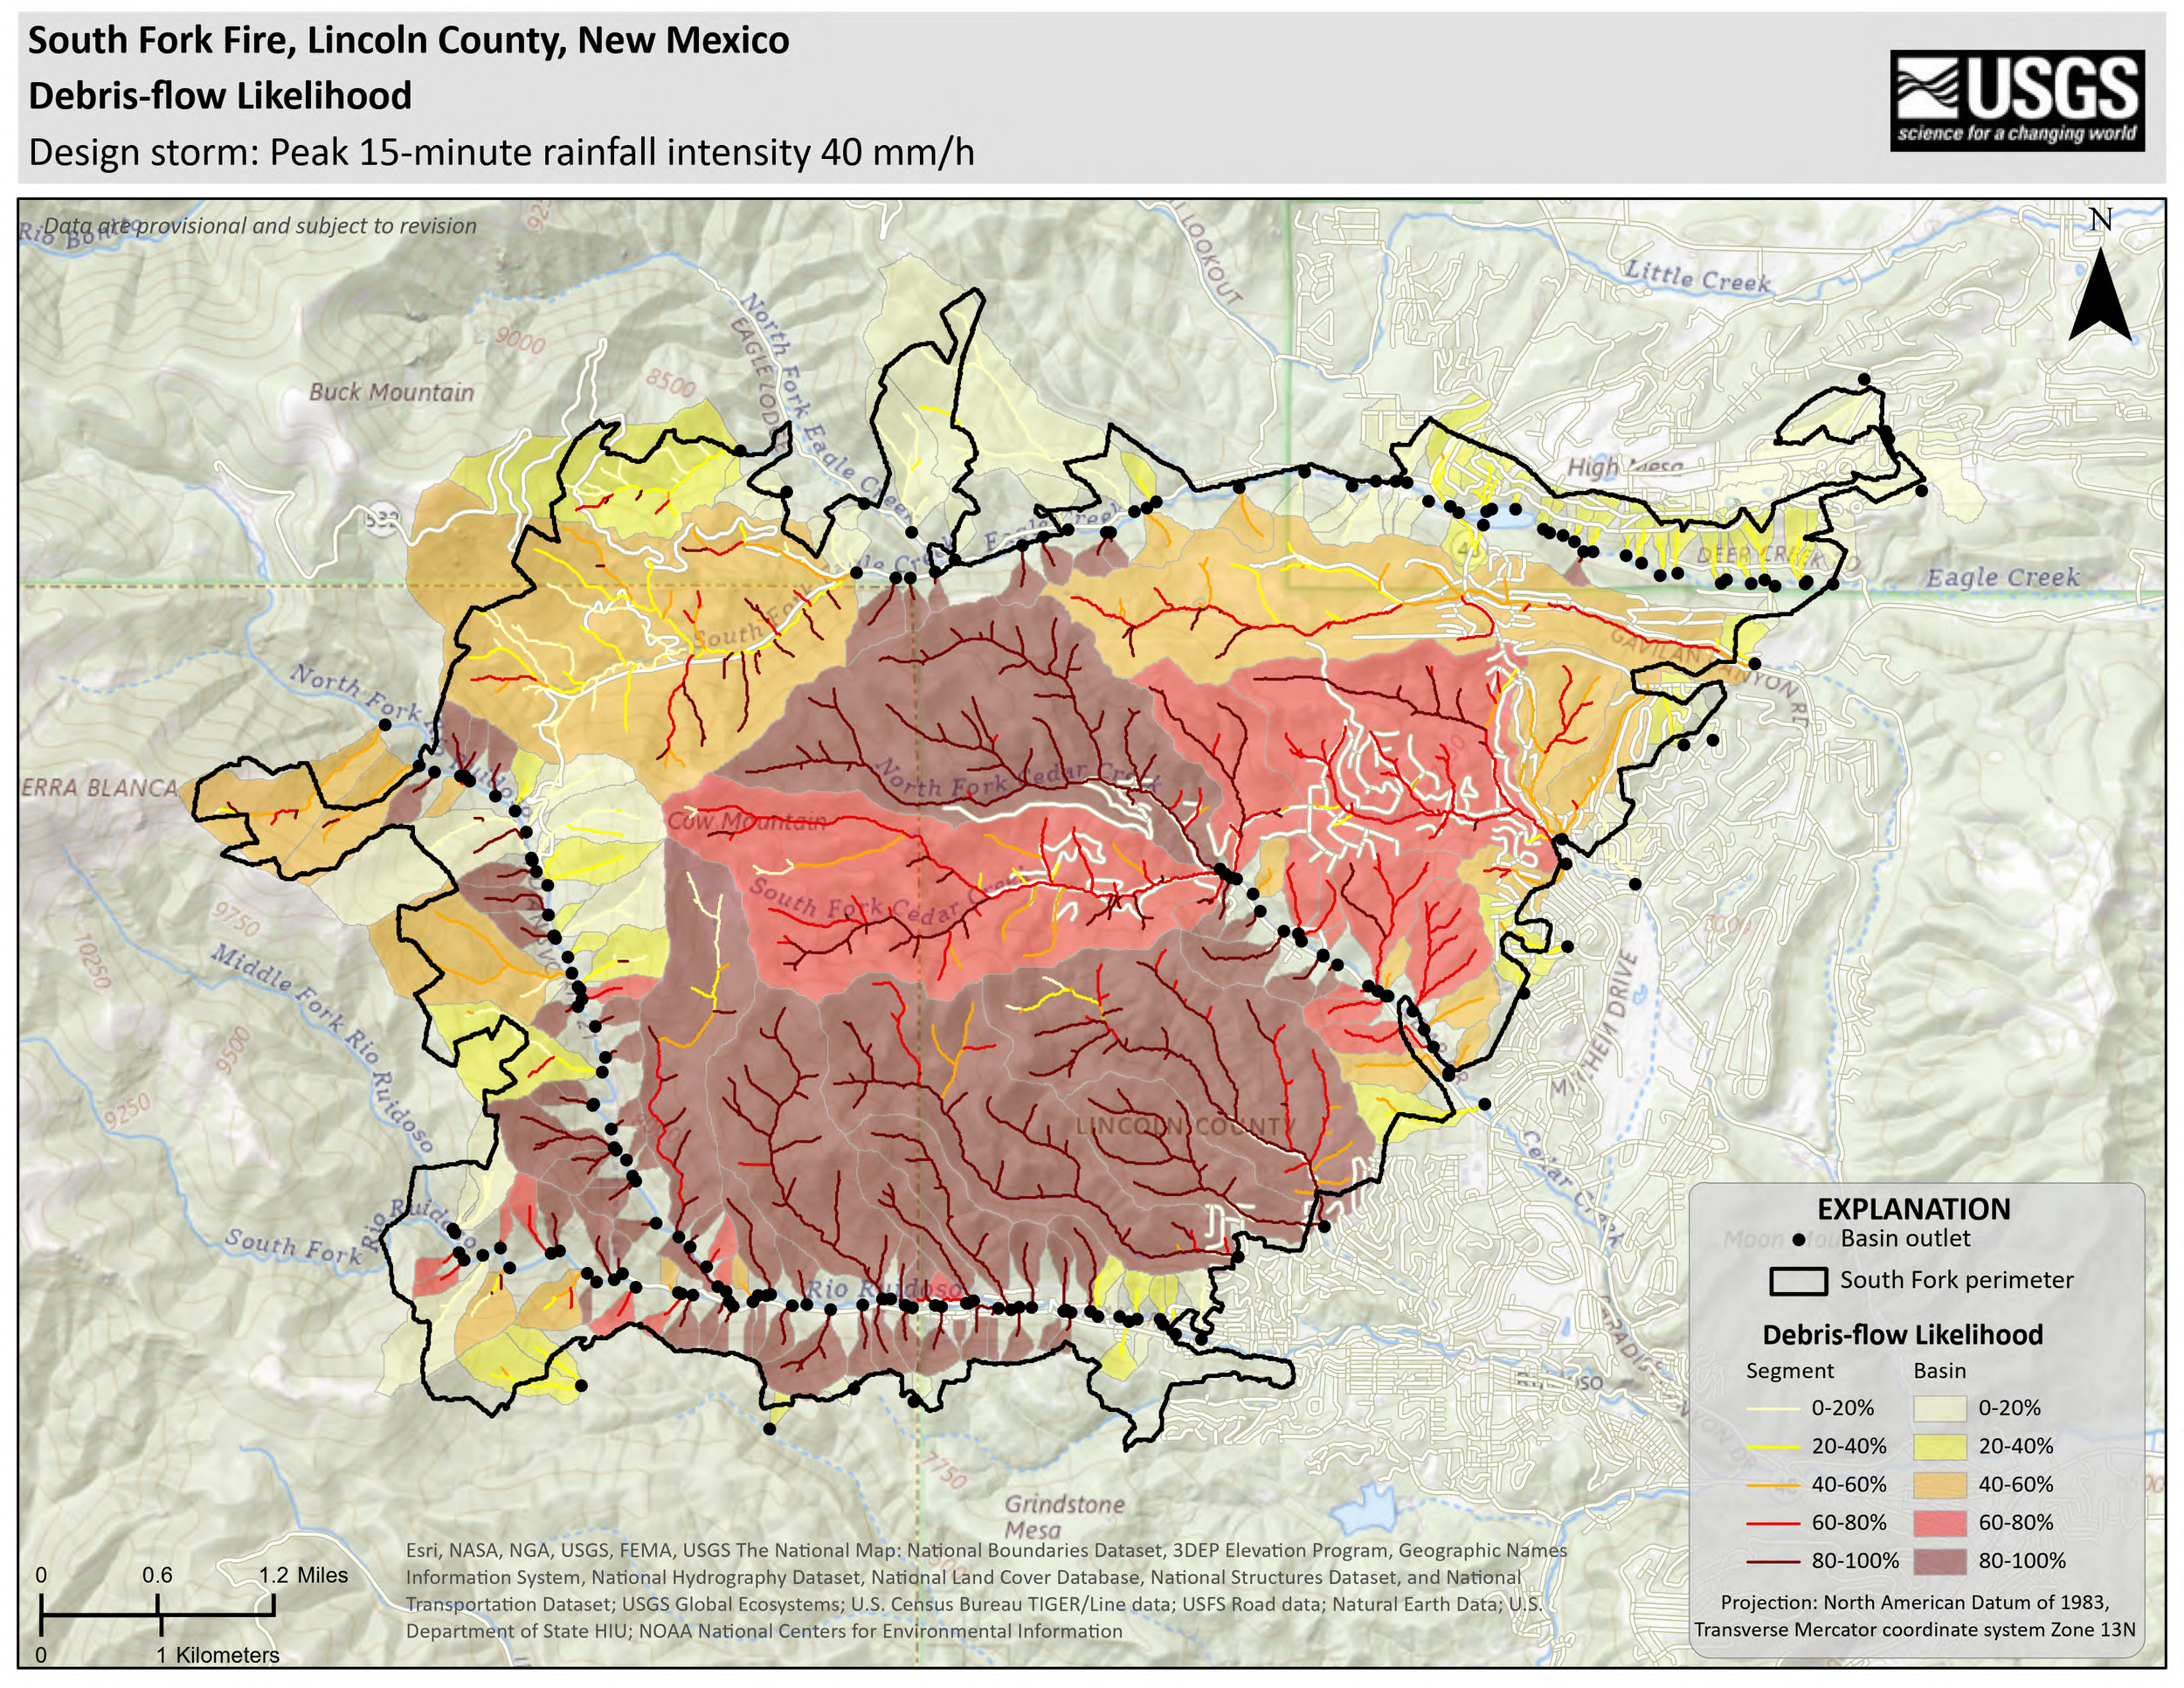
The USGS map linked in the municipal BAER gallery specifies a peak 15-minute rainfall intensity of 40 mm/h. It displays likelihood classes for both basin areas and channel segments, marks basin outlets and labels its data provisional. The map was visually inspected for this study. [5]
Unit check: 40 mm/h × (15/60 h) = 10 mm in 15 minutes. That converts an intensity into the rainfall depth for that interval. It does not say a full hour of rain occurred, that the entire fire received an identical storm, or that 10 mm is an operational safety threshold.
A likelihood colour must stay attached to its design storm and mapped unit. Reading an 80–100% class as an annual flood chance would discard the conditioning information in the title. Reading it as a percentage of homes destroyed would replace the mapped outcome with a different one. Neither conclusion follows from this map.
For a defensible map interpretation, first identify the storm duration, then the basin or segment, then the modelled outcome. Keep the version and provisional status with any extracted number. This study does not digitize the image, count coloured pixels or intersect it with addresses. The published map is useful evidence of the scenario that was assessed; it is not a current warning feed.
Observed post-fire flows and treatment proposals are different evidence
A USGS image catalogued on 27 June 2024 describes flooding and debris flows during rain after South Fork near Ruidoso. A second USGS image, catalogued on 29 October 2024, documents a debris-filled channel in the Cedar Creek drainage. Together they provide descriptive evidence of post-fire channel impacts. [6] [7]
The catalogue dates are not a reconstructed storm chronology. Photographs without paired rainfall observations, surveyed deposits and event timing cannot establish a rainfall threshold, a transported volume or a return period. An observed deposit also does not validate every probability class across an entire map.
The 17 July BAER summary describes greater runoff, erosion and sediment concerns, including Cedar and Perk Canyons, and proposes stabilization work for Forest Service Road 127A. Its discussion of risk lasting at least two years is a 2024 assessment, not a statement that the area became safe exactly two years later. Proposed treatments are not proof of completed work or measured effectiveness. [4]
A recovery assessment needs its own dated observations: vegetation and ground cover, channel condition, road drainage, storm history and treatment inspection. Visible green regrowth alone would not answer all those questions. This record does not establish the condition of any specific road, drainage or property in October 2026.
What soil severity means, and what we actually analysed
The Forest Service field-data extract records ground cover, ash, soil structure, roots and water repellency, together with site characteristics. It calls for comparison with similar unburned conditions and professional judgment. Soil severity therefore involves several ground indicators; a photograph of blackened tree crowns is not a substitute for that assessment. [9]
The USGS BAER data catalogue lists imagery, differenced NBR, boundaries and metadata. A validated soil burn severity classification may be released at the BAER team’s discretion. Availability of a satellite-change product does not, by itself, establish that a field-validated classification for this particular fire has been obtained. [8]
Work performed here: review of dated primary agency pages; visual inspection of the scenario map; transcription of the published areas and proportions; category grouping; percentage-point subtraction; a rainfall-unit conversion; and generation of an original chart from those values. The accompanying data and code reproduce those calculations.
Evidence boundary: we did not obtain the native South Fork severity raster, its class-area denominator or an event rainfall series, and did not conduct field observations. The municipal narrative summaries were examined; a complete underlying BAER technical report was not independently audited. The field-method source used here is the available three-page extract, not a claimed full-document review.
These limits define what another analyst can reproduce: the reporting comparison and arithmetic, not the original mapping or hydrological model. A future update could replace the bounded transcription with native-data analysis, but it should state the additional files, methods and changes rather than silently upgrading the evidence claim.
Questions the record can answer
| Question | Supported answer | Evidence still needed for a stronger claim |
|---|---|---|
| Did the two fires have the same severity distribution? | The reported three-bin proportions differ. | Native classifications and compatible spatial denominators for a spatial comparison. |
| Does the larger incident area prove later fire growth? | No; the figures come from differently labelled reports. | Dated boundary versions and a common area method. |
| Does a map likelihood describe annual risk? | The inspected map specifies a rainfall scenario. | Storm occurrence probabilities and an appropriate annual-risk model. |
| Did proposed mitigation eliminate flooding? | The reviewed summary establishes proposals, not that outcome. | Completion records, maintenance inspections and monitored storm response. |
South Fork’s analytical value is the connection between several evidence types: incident reporting, soil classifications, scenario modelling and observed deposits. Keeping their units, dates and scopes visible produces a more useful case study than merging them into one dramatic number.
Primary sources and review scope
- Bureau of Indian Affairs: South Fork cause statement. Agency finding; includes a 3 July 2024 status checkpoint.
- NM Fire Info: South Fork and Salt update, 2 July 2024. Incident dates, identities and reported areas.
- Ruidoso municipal government: BAER operational update, 3 July 2024. Published area and soil-severity percentages.
- Ruidoso municipal government: Lincoln National Forest BAER summary, 17 July 2024. Later area figures, rounded classes, hydrology and treatment proposals.
- USGS South Fork debris-flow likelihood map in the BAER gallery. Title, design storm, legend and provisional annotation visually inspected; image linked, not digitized.
- USGS: 2024 South Fork postfire flows. Descriptive photographic record; catalogue date 27 June 2024.
- USGS: debris-filled channel in the South Fork burn area. Cedar Creek drainage; catalogue date 29 October 2024.
- USGS BAER data access. Product availability and the distinction between imagery support and a released validated classification; reviewed 13 October 2026.
- Forest Service soil burn severity field-data sheet and key. Three-page extract from RMRS-GTR-243 (2010), printed pages 40, 41 and 49; ground indicators and observation scope.